Swinton Interactive Infographic Case Study
Moving beyond the infographic - Mobile first data visualisation
Insight
Swinton Insurance is one of the UK's leading insurance brokers and a global provider of insurance products including car, home, bike and taxi insurance.
We were tasked with providing innovative, interactive, and mobile-first data visualisations for large data sets from survey results and other collection techniques that Swinton had recently completed with industry partners that included social media data, hazardous road data for motorbikes, and local crime statistics.
After combing through the data, we advised Swinton that we could design and build a more innovative digital solution; a responsive, dynamic, interactive and shareable infographic that allows users to explore and engage with the content resulting in increased user knowledge and, ultimately, customer retention for Swinton.
Objectives
Take complex datasets by topic and visualise the data in a digital format to provide relevant, regional information to Swinton's customers through dynamic, responsive, and interactive web applications embedded on their existing website.
Ensure the data visualisation solution and web application can be used efficiently across all devices using responsive and mobile-first design strategies.
We created two distinct maps including Britain's Most Dangerous Roads and Social Media Crime Map with accompanying responsive infographics that allow users to share specific content on social media.
Britain's Most Dangerous Roads
View infographicSocial Media Crime Map
View infographicOur agency approach
Large, complex datasets pose considerable challenges for any visualisation project and require innovative solutions to prioritize usability and readability. Working with user experience and mobile-first design considerations at the start, we focused our efforts on ensuring the user could digest both the national dataset as well drill down into regional information on any device.
In order to move away from the traditional, static infographic and standard Google Maps integration, we developed a solution that allowed users to cycle through segments of the data to personalise their experience and draw meaningful conclusions about what means most to them.
Bridget Southwell (Persona)
Manchester
Using the UK Doubt Map, Bridget can see that almost everyone else in the UK shares her worry of saving for the future, but people in London seem to be more worried about losing their main source of income. Perhaps Manchester is the best spot for her after all.
In order to accomplish this, we iterated through a number of designs and visualizations in order to find the most suitable layout for Swinton’s customers. This was especially critical for the Social Media Crime Map that required both radial and heat visualisation.
Providing this type of solution can be digitally heavy. Maps, images, and data all require computing power that can lead to lengthy page loads and an depreciated user experience.
With the release of the UK's Most Dangerous Roads, Google Maps presented the most logical solution to provide the mapping element given the required functionality. For the final two applications, we chose Mapbox, an open source, location data platform to provide a scalable solution that provides a slicker, vector map solution.


Results
Britain's Most Dangerous Roads proved to be an overwhelming success providing Swinton Insurance with an owned digital asset that helps inform their customers and position the broker as an industry leader in motorbike insurance with safety as the primary concern.
- Nominated at 4 award ceremonies
- European Search Awards 2018
- UK Search Awards 2017
- Northern Digital Awards 2017
- Northern Marketing Awards 2017
As a digital agency, we have other KPI's. Page 1 ranking keywords increased by 1,175% after campaign activation. We also wanted to make sure that the data was both accessible to all visitors, no matter what the device, and personable, leading to insights that could help real people make real decisions.
At the time of the Bike campaign it was the most viewed content in Swinton's Spotlight section, with an average viewing time of 2min 14sec which was above the average of 1min 48sec. The device split was 49% desktop, 51% mobile.
mobile score
The site works for people regardless of the device
faster load time than main site average
Content loads fast to keep visitors engaged
average time
Spent engaging with nagging doubt infographic
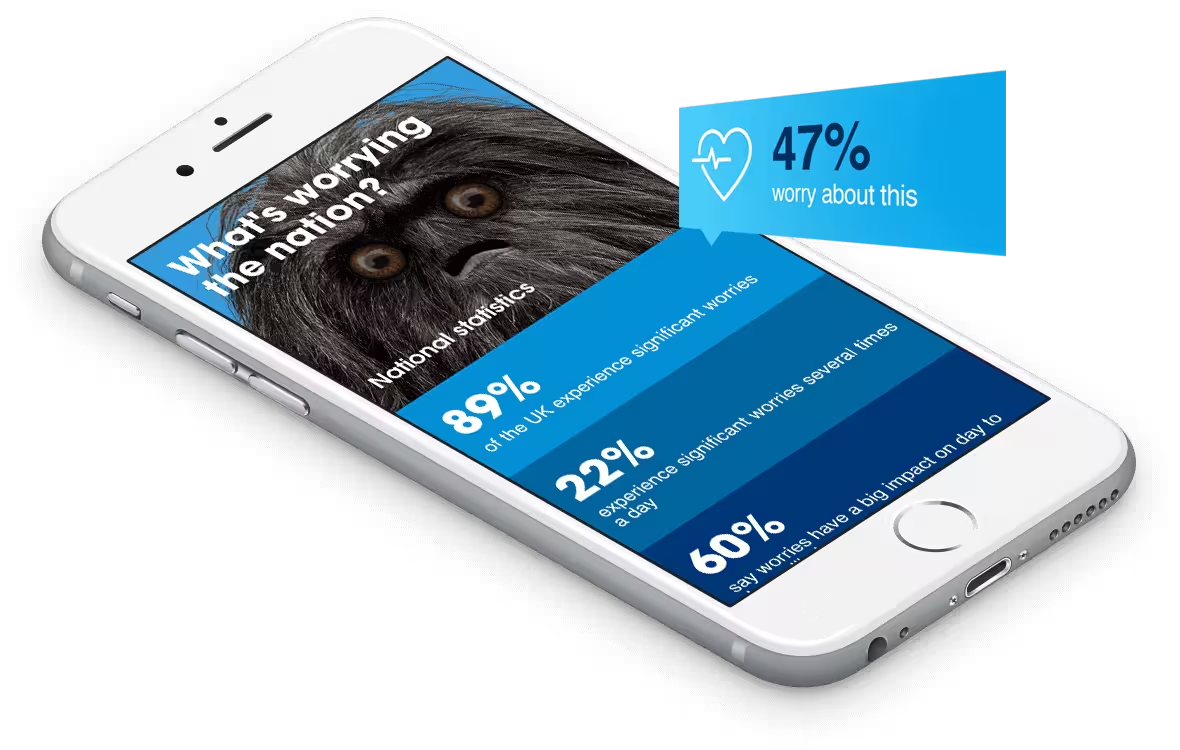
UK's Doubt Map is currently part of an active campaign to report the findings of a survey conducted by Swinton Insurance. From the current numbers and social media sentiment, we can see that the campaign in general is a huge success.
From our perspective, we can say that users are taking the time to interact with the map.
Don't just take our word for it
The interactive, responsive maps provided an engaging experience for existing customers and helped us grow our online audience.
Thomas Heavisides
Digital Marketing Manager, Swinton Insurance

Let's work together.
Call our Managing Director Andy on 0800 680 9777 or fill in our to discuss how we can help.